
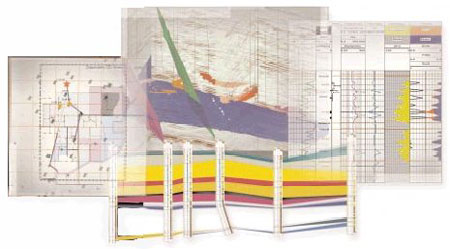
GeoGraphix's Discovery 2000.3 released

An essential part of Discovery's evolution as a complete reservoir characterization system, says Landmark, the 2000.3 release incorporates new tools and templates that store measured and interpreted data in a common location, accessible by any geologist, geophysicist, or petroleum engineer working on a project.
According to Landmark, simplified data importing and data management are built into this version, and the it includes the first phase of Discovery complex zone analysis capabilities. The new "ZoneManager" tool is said to exploit the system's shared data model by providing qualitative prediction capabilities for use in any identified area of interest, enabling geoscientists to now cross correlate data and zone attributes across disciplines to detect even subtle relationships that can be used to project attributes away from the wellbore. This allows users to predict properties at the next well location for reservoir simulation, risk analysis or field studies.
"By integrating geologic and seismic interpretations into a single workflow environment, our customers can utilize well data to constrain seismic data and increase the reliability and robustness of their final interpretations," said John Gibson, Landmark's president and CEO.
In addition to Discovery's new data integration and statistical analysis tools, the new release is said to also feature functional integration of LogM geophysical modeling tools. These tools, designed primarily for stratigraphic plays, allow geoscientists to tie together and test geophysical interpretation with geological hypotheses, building confidence in their interpretation's integrity. Users can quickly see how zones respond seismically as attributes are altered, allowing the geoscientist to verify the geologic framework on their seismic data.
The 2000.3 release is described as incorporating a wide range of new tools including thematic mapping presentations, a new petrophysical math engine, 3D seismic interpretation autopicking, and volumetrics functionality that enables users to calculate oil and gas in place for estimating recoverable hydrocarbon reserves. In addition, new line balancing and 2D attribute extraction functionality have been added to the seismic interpretation system, SeisVision to provide geoscientists a method for preparing 2D lines for analysis, including unifying seismic data interpretation, by normalizing phase, frequency, and time. Users can view their legacy 2D data from a perspective never taken before.